Today I’m sitting down with the OrxaGrid development team to discuss their interactive Single Line Diagram which allows users to easily create, edit and export their single line diagrams.
The OrxaGrid Analytics Platform features an editable and configurable Single Line Diagram (SLD) tool that brings live system monitoring data from on-site sensors. Having an SLD tool that shows power system data in real-time is useful for substation operators, field engineers and energy managers.
What is a SLD?
In power engineering, a single-line diagram (SLD) — also sometimes called a one-line diagram — is a simplified notation for representing a three-phase power system. It is a form of block diagram graphically depicting the paths for power flow between entities of the system.
SLDs are common globally and pretty much all electrical engineers use the same standardised schematic symbols to represent different electricity network components such as circuit breakers, transformers, capacitors, bus bars, and conductors.
What challenge are you addressing with the SLD maker?
While working with partners installing and monitoring devices on the medium to low voltage network, we were surprised to see how analogue global practices still are. It is still not uncommon for utility companies to have their distribution network data only on datasheet plates, paper documents, or Excel files.
If data around the network was digitised, it was typically in an inflexible system that could not be exported or combined with real-time data — the data couldn’t be mapped in a visual way.
Everyone knows relying on inflexible data structures and poor data visualisations makes life hard. For example, when our clients looked at outage data, they couldn’t easily identify other key information — such as the customers a feeder was serving, or whether the feeder was near a school, temple, railway station, or major road. It was also difficult for users to see relationships between two feeders in an Excel file, and certainly difficult to see the location of components and assets such as a circuit breaker, power transformer, or switchgear.
How big is this problem?
If utility and distribution network managers only had to maintain a handful of substations, using Excel sheets would not be such a big issue. But medium and low voltage substations are ubiquitous — found about 150–200 metres apart in a typical urban area. That means our clients maintain thousands of medium and low voltage substations in their networks.
Then why haven’t most SLDs been digitised yet?
This is where the predicament comes in. Because substations are so numerous, a single substation is considered a “non-critical” energy system component compared to high-value, high-voltage counterparts.
Legacy systems are designed for a small number of high-value assets, making it cost prohibitive to include thousands of additional assets and their SLDs. Legacy systems also make it difficult to export data, meaning uploading all that data would not be a one-time effort that could be shared across systems.
All these factors made digitisation a monumental and unappealing task with little promise for a real return on investment.
The OrxaGrid Solution: The SLD Viewer
Our utility clients expressed a need for a tool that would allow them to digitise their real-time energy network data in a dynamic way. They knew that having their data in a standardised and usable format was key to enabling employees and stakeholders to drive value from their energy data — to get more efficiency from their network and prevent breakdowns.
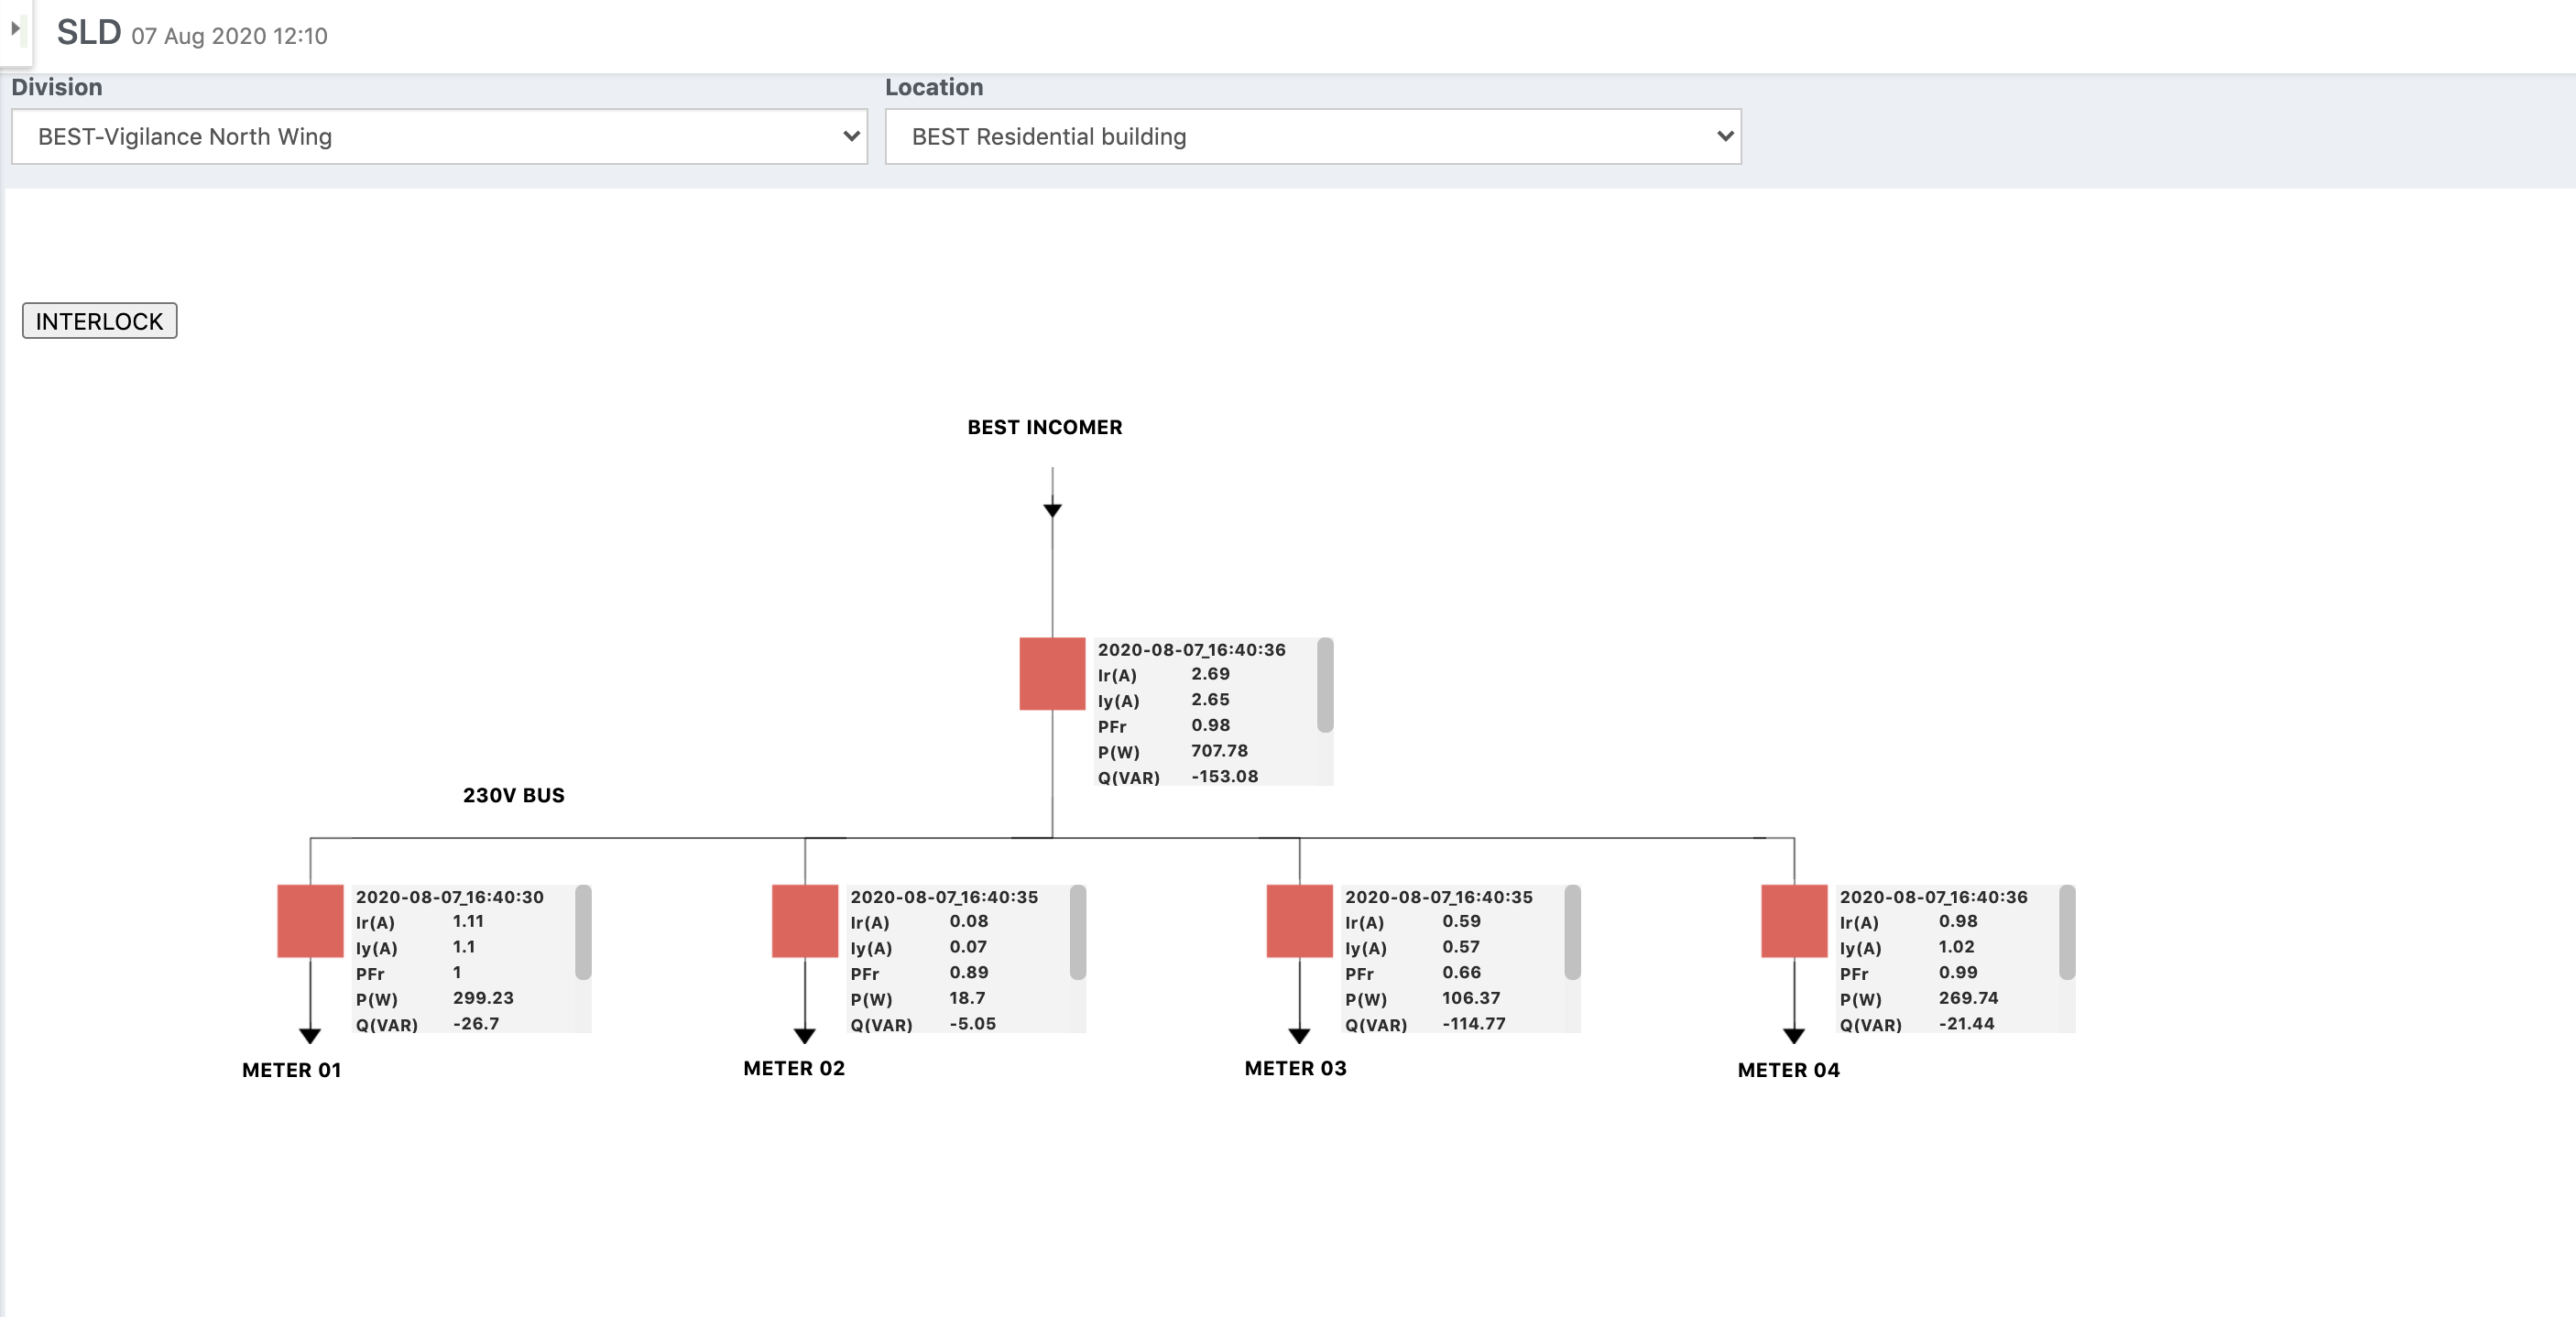 A screenshot of our SLD Viewer
Hence, we set out to include an SLD Viewer in the Grid Analytics Platform (GAP) that gave a complete and consolidated view of network assets and connectivity in real-time.
We started by creating a digitised version of each SLD using an SVG file and integrating with APIs to show live data from our IoT devices. When used with OrxaGrid’s monitoring devices or SCADA system, the SLD viewer can show users key metrics across their distribution network in real-time.
It became easy for engineers to remotely spot closed and open circuits or identify an unbalanced load that may damage transformers. It also simplified feeder benchmarking, power transformer maximum permissible load, and impact analysis of distributed energy resources on substations. Because it is a web-based application, it doesn’t require users to download or install any special software.
The SLD Editor
As we grew, we started getting far more requests to create new SLDs from utility clients — so we developed a self-service tool that makes it quick and easy for system engineers to create, manage, share, update, and export their own SLDs.
Our SLD Editor allows users to drag, drop, and arrange different SLD components such as lines, busbars, circuit breakers, and isolators from a predefined symbol library to create a digital version of the SLD that engineers usually draw on paper.
The symbol library is customisable so we can include new sets of symbols to create SLDs as per different standards (e.g. IEEE / IEC). After an SLD is created, users can link symbol components to real assets in the system which can hold streaming measurement and status data. The editor allows flexibility to display only the required live parameters as per the customer’s needs.
Users can configure symbol components to display live parameters from smart devices such as voltage, current, and power. Digital status such as breaker position, relay operation status, and isolator status can also be added.
The Future
We are excited to incorporate new features to our SLD editor tool, including:
- Direct Uploader of New Symbols — a symbol uploader functionality to increase the freedom of users to create custom symbols of their choosing.
- Asset Controlling through SLD — users will be able to remotely control their assets using the SLD, incorporating advanced functionalities such as Select-Before-Operate, Direct Control, and Interlocking Logic creation.
- Customised Colouring of SLD Components — users will be able to create custom colours for SLD components and define logic-based colouring, such as changing the HV bus colour if it is in an overloaded condition.
How is it available?
For more information on our Grid Analytics Platform and its features, please contact us or email info@orxagrid.com.
OrxaGrid is an IoT and data analytics company on a mission to enable a reliable, affordable and sustainable energy future for all.